Analytics and deliverability
Read your sending numbers, find which slice moved, and keep your inbox reputation healthy.
Three screens in the console answer three questions:
- Overview: is everything OK right now?
- Analytics: what happened, and where?
- Deliverability: will my mail keep landing in the inbox?
The same totals are available over the API from
GET /v1/stats.
Overview
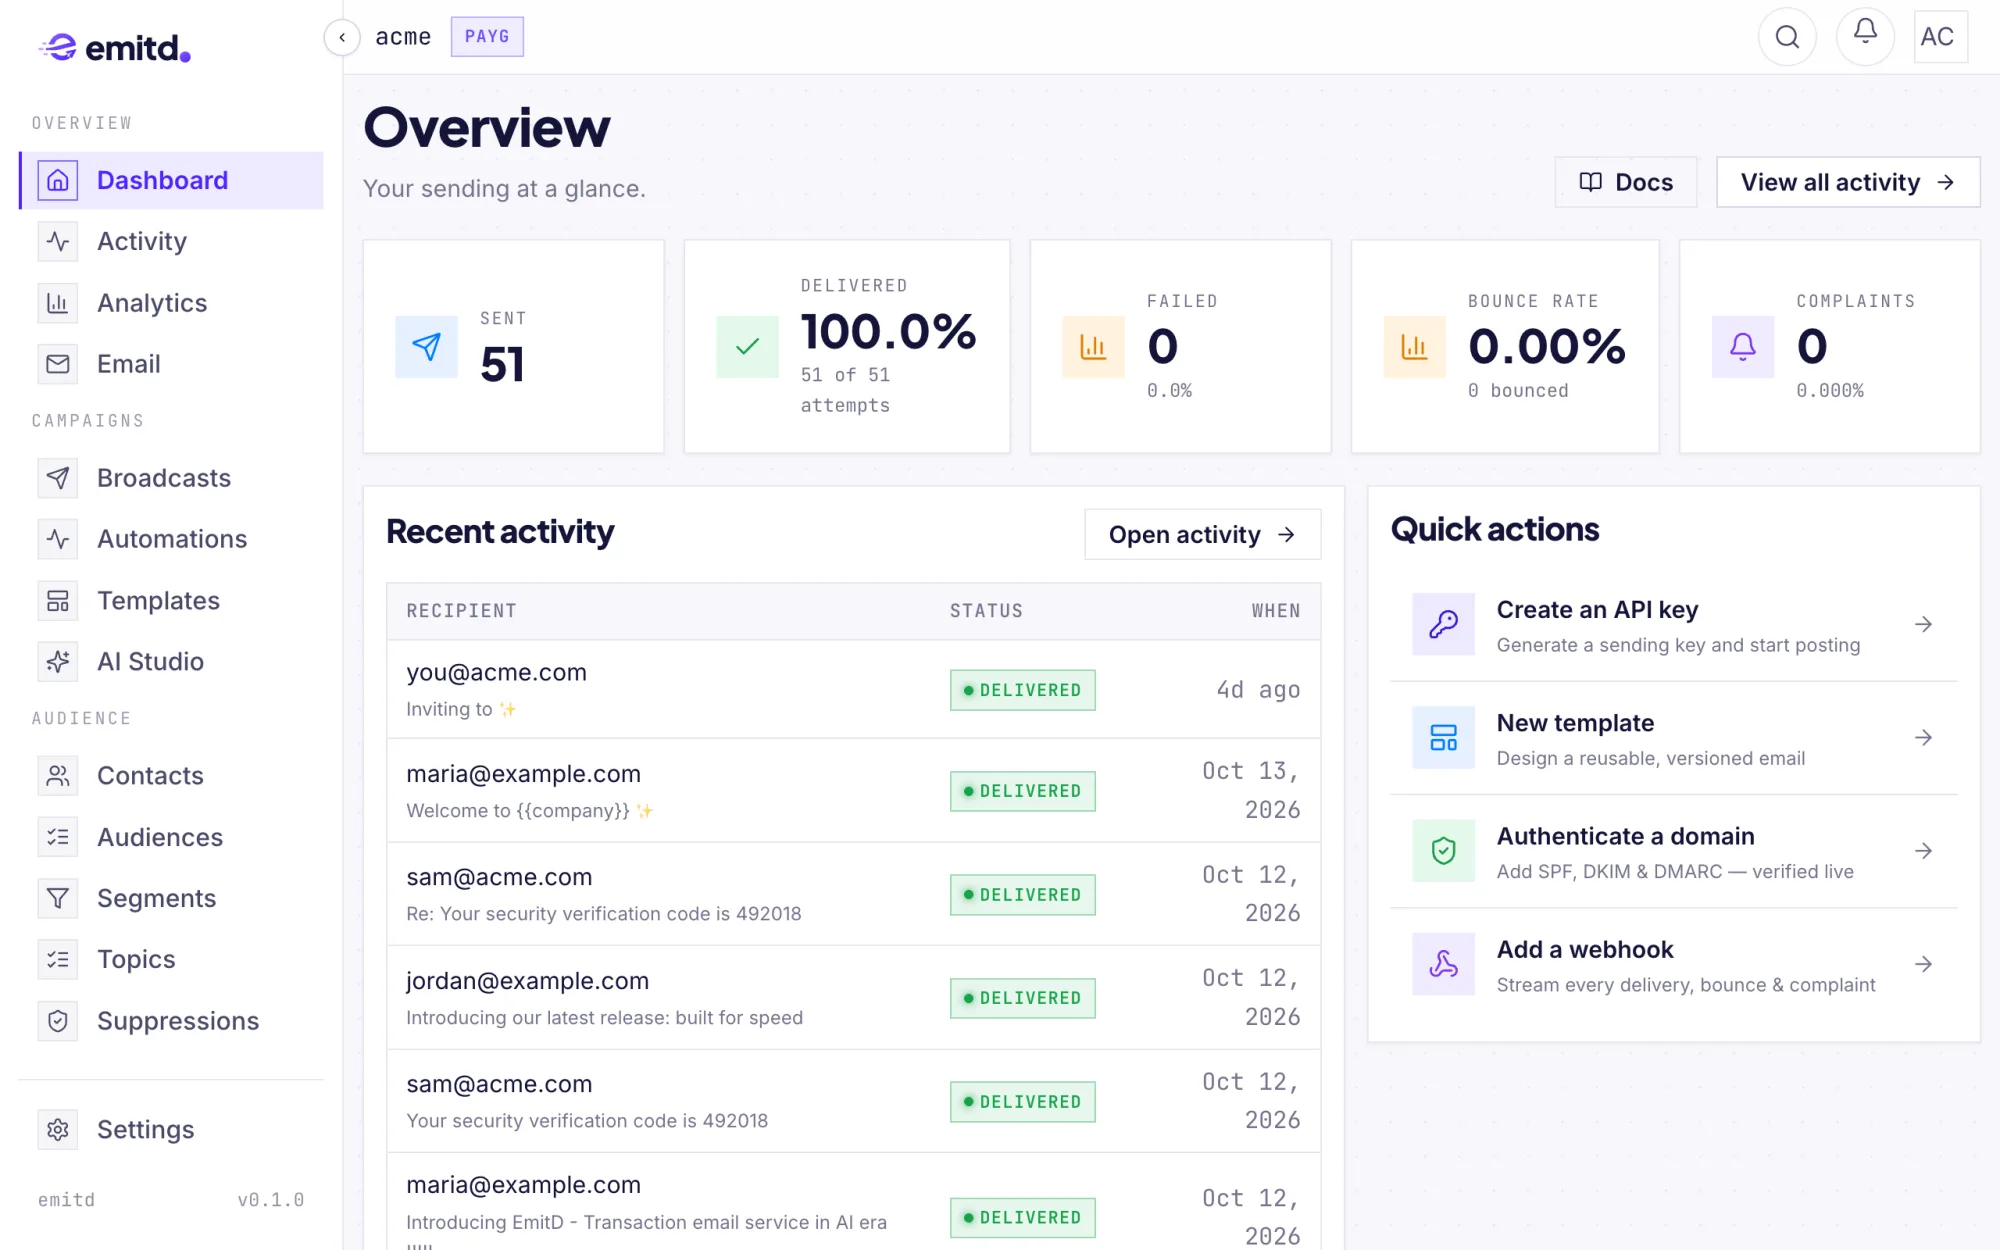
Dashboard → Overview is the first screen after you sign in. It shows the messages sent, the delivery rate, failures, the bounce rate and complaints, along with your most recent messages and shortcuts to the setup steps (an API key, a template, a domain, a webhook).
Analytics
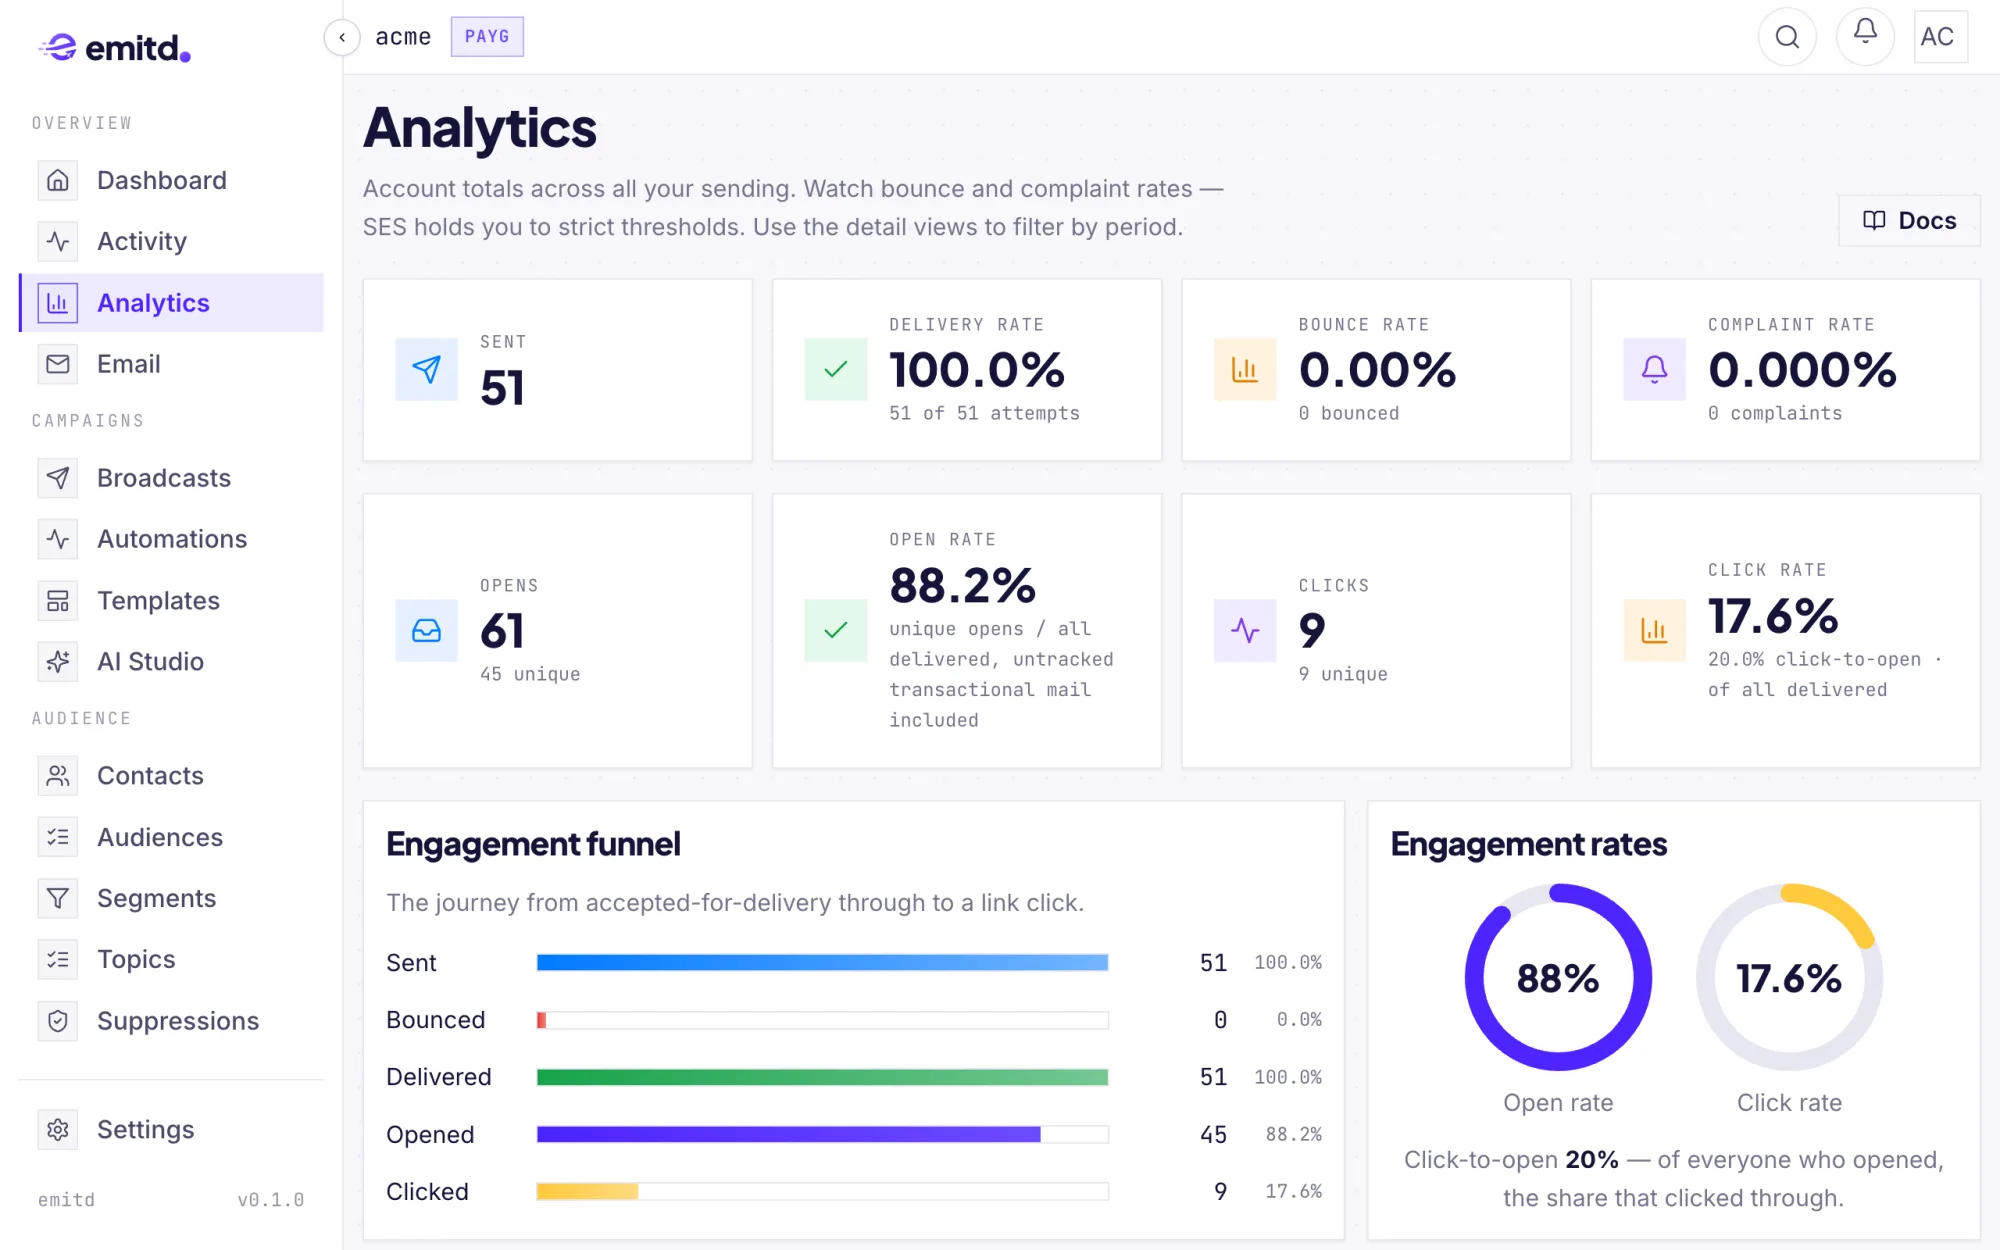
Dashboard → Analytics shows account-wide totals:
| Tile | What it counts |
|---|---|
| Sent | Messages accepted for delivery |
| Delivery rate | Delivered ÷ delivery attempts |
| Bounce rate | Bounced ÷ sent. Mailbox providers start penalising senders around 5%. |
| Complaint rate | Spam reports ÷ sent. The danger line is 0.1%. |
| Opens, clicks | Total and unique, for tracked mail |
| Open rate, click rate | Unique opens or clicks ÷ delivered mail that was tracked |
Open and click rates count only mail that carried an open pixel or tracked
links: broadcasts, and transactional sends that set track_opens or
track_clicks. Untracked mail can't report an open, so it's left out rather
than pulling the rate down. GET /v1/stats returns the same denominators as
delivered_open_tracked and delivered_click_tracked.
Below the tiles, the engagement funnel follows mail from sent to delivered, opened and clicked. Click-to-open shows the share of openers who clicked through.
Detail views
When a number moves, the detail views show which slice moved:
- Volume: the same sending total broken down by status, stream (transactional or broadcast), sending domain, recipient domain and template.
- Engagement: every tracked link and the messages that drive the most opens and clicks.
- Deliverability detail: how each mailbox provider (Gmail, Outlook, Yahoo…) is treating your mail, why sends failed, and every bounce and complaint. A healthy overall average can hide one provider that is rejecting you, so check this view when delivery dips.
Deliverability
Infrastructure → Deliverability summarises your inbox health over the trailing 30 days.
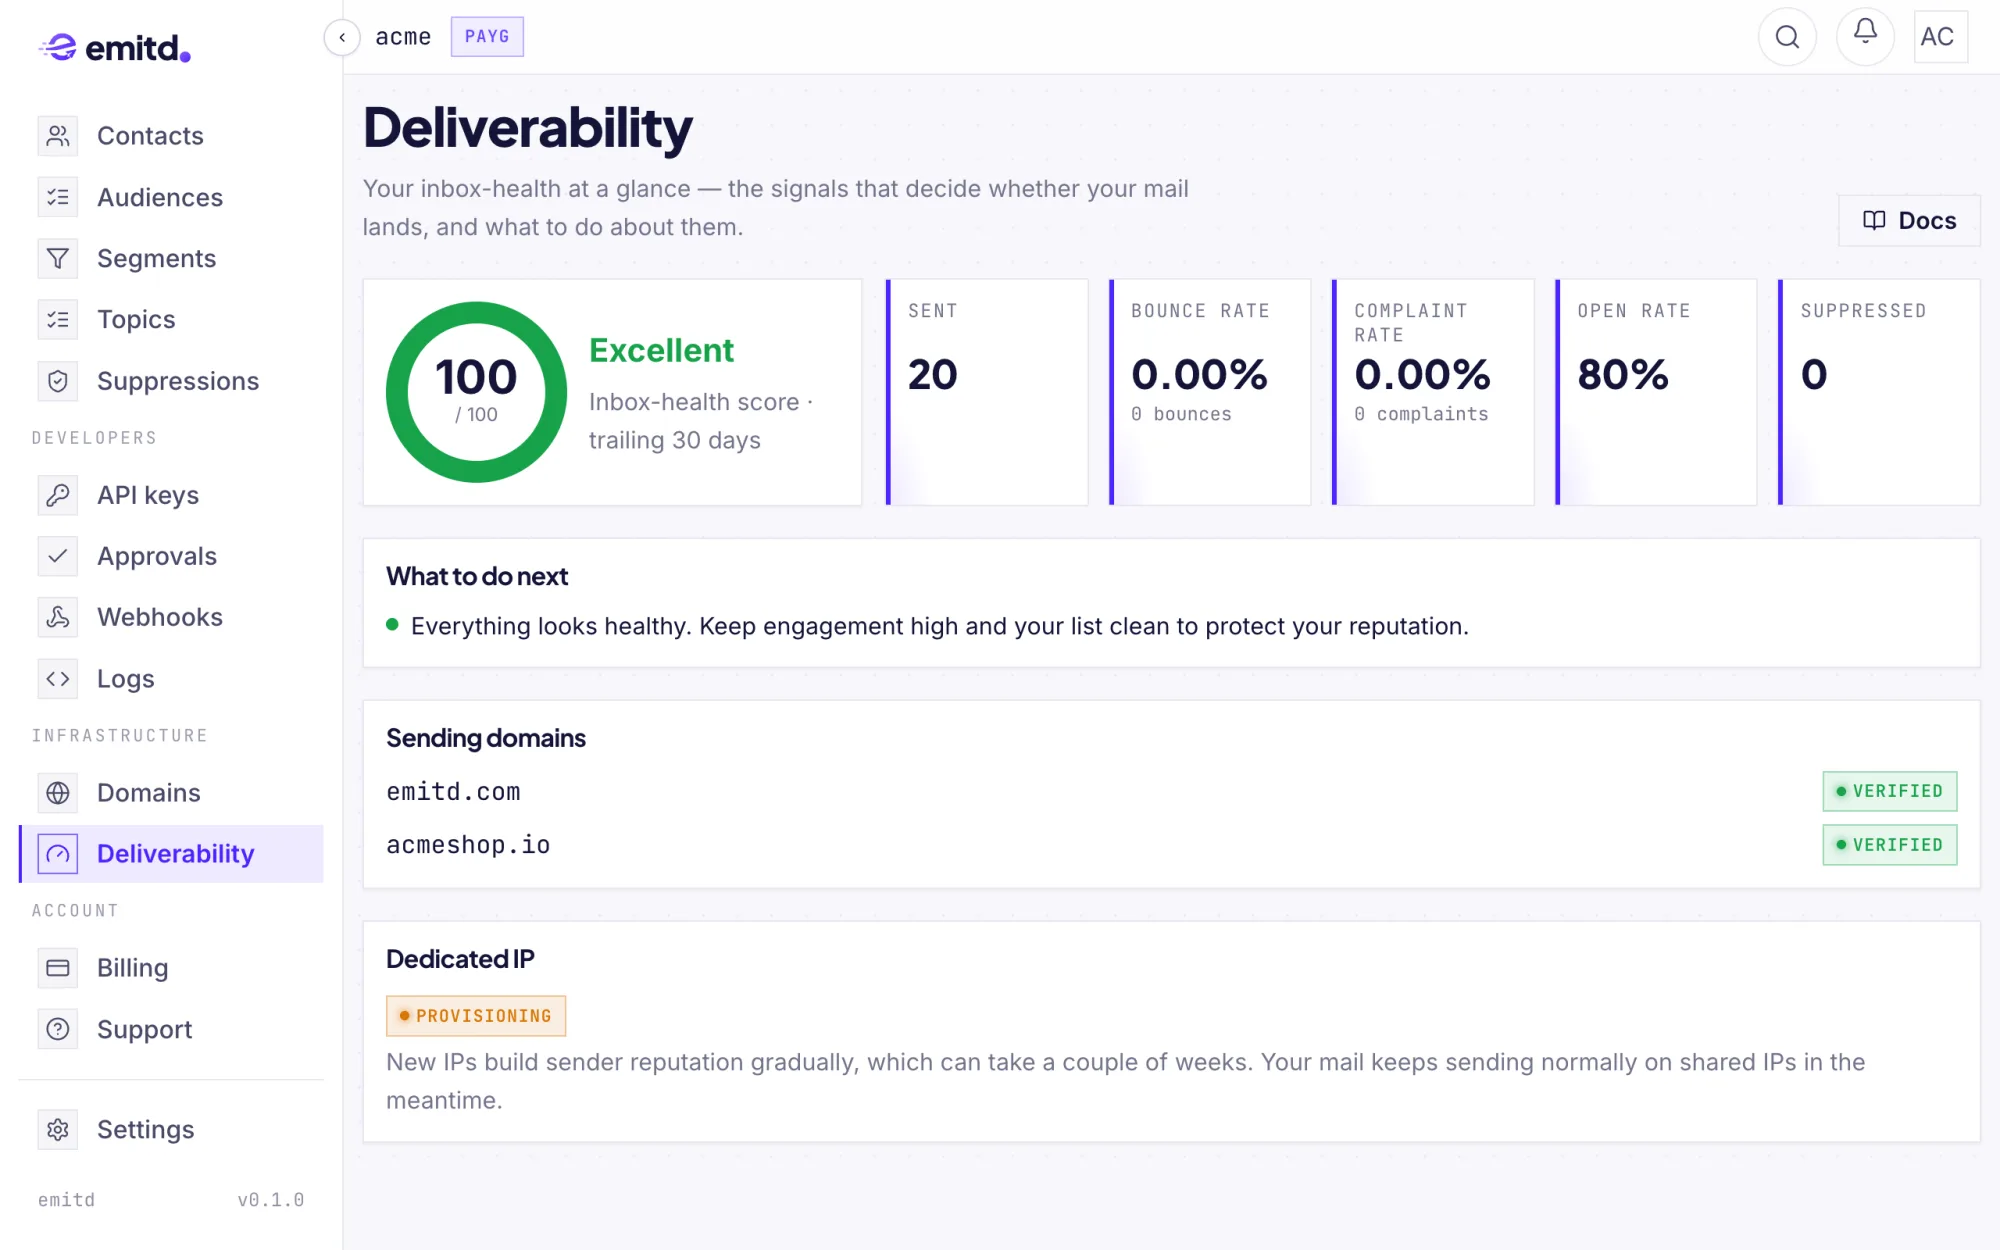
The inbox-health score runs from 0 to 100. Bounce and complaint rates each cost up to 50 points as they approach their danger lines (5% bounces, 0.1% complaints), and reaching a line costs all 50:
| Score | Status |
|---|---|
| 90–100 | Excellent |
| 75–89 | Good |
| 50–74 | At risk: find the source of the bounces or complaints now |
| below 50 | Critical |
Below 20 sends in the window the rates are too noisy to judge, so the score shows as New.
What to do next turns the numbers into one or two concrete steps, such as cleaning a list or fixing a domain record. The screen also shows each sending domain's verification state and, if you have one, your dedicated IP and its warm-up status.
Keep the rates low before they become a problem
Validate addresses where you collect them (address validation), and let hard bounces and complaints land on your suppression list. emitd also drops recipients whose domain can't receive mail before they are sent, so typo'd domains never count against you.